Author:
Michella SalvittiCo-Authors:
Dr. Richard ClarkInstitution:
Millersville UniversityAbstract
The collateral impact of emissions present in the atmosphere is exacerbated by the increased in ambient air temperatures. Utilizing the Environmental Protection Agency ‘s (EPA) outdoor air quality data from AirNow, we focus on the pollutants ozone and PM2.5 in Lancaster, Pennsylvania. This study is focused on days that recorded daily ozone and PM2.5 Air Quality Index (AQI) values that fell within a range of air quality that is unhealthy for sensitive groups to hazardous quality. Over the past two decades, 2000-2020, the days that reached AQI values within the range of focus decreased.
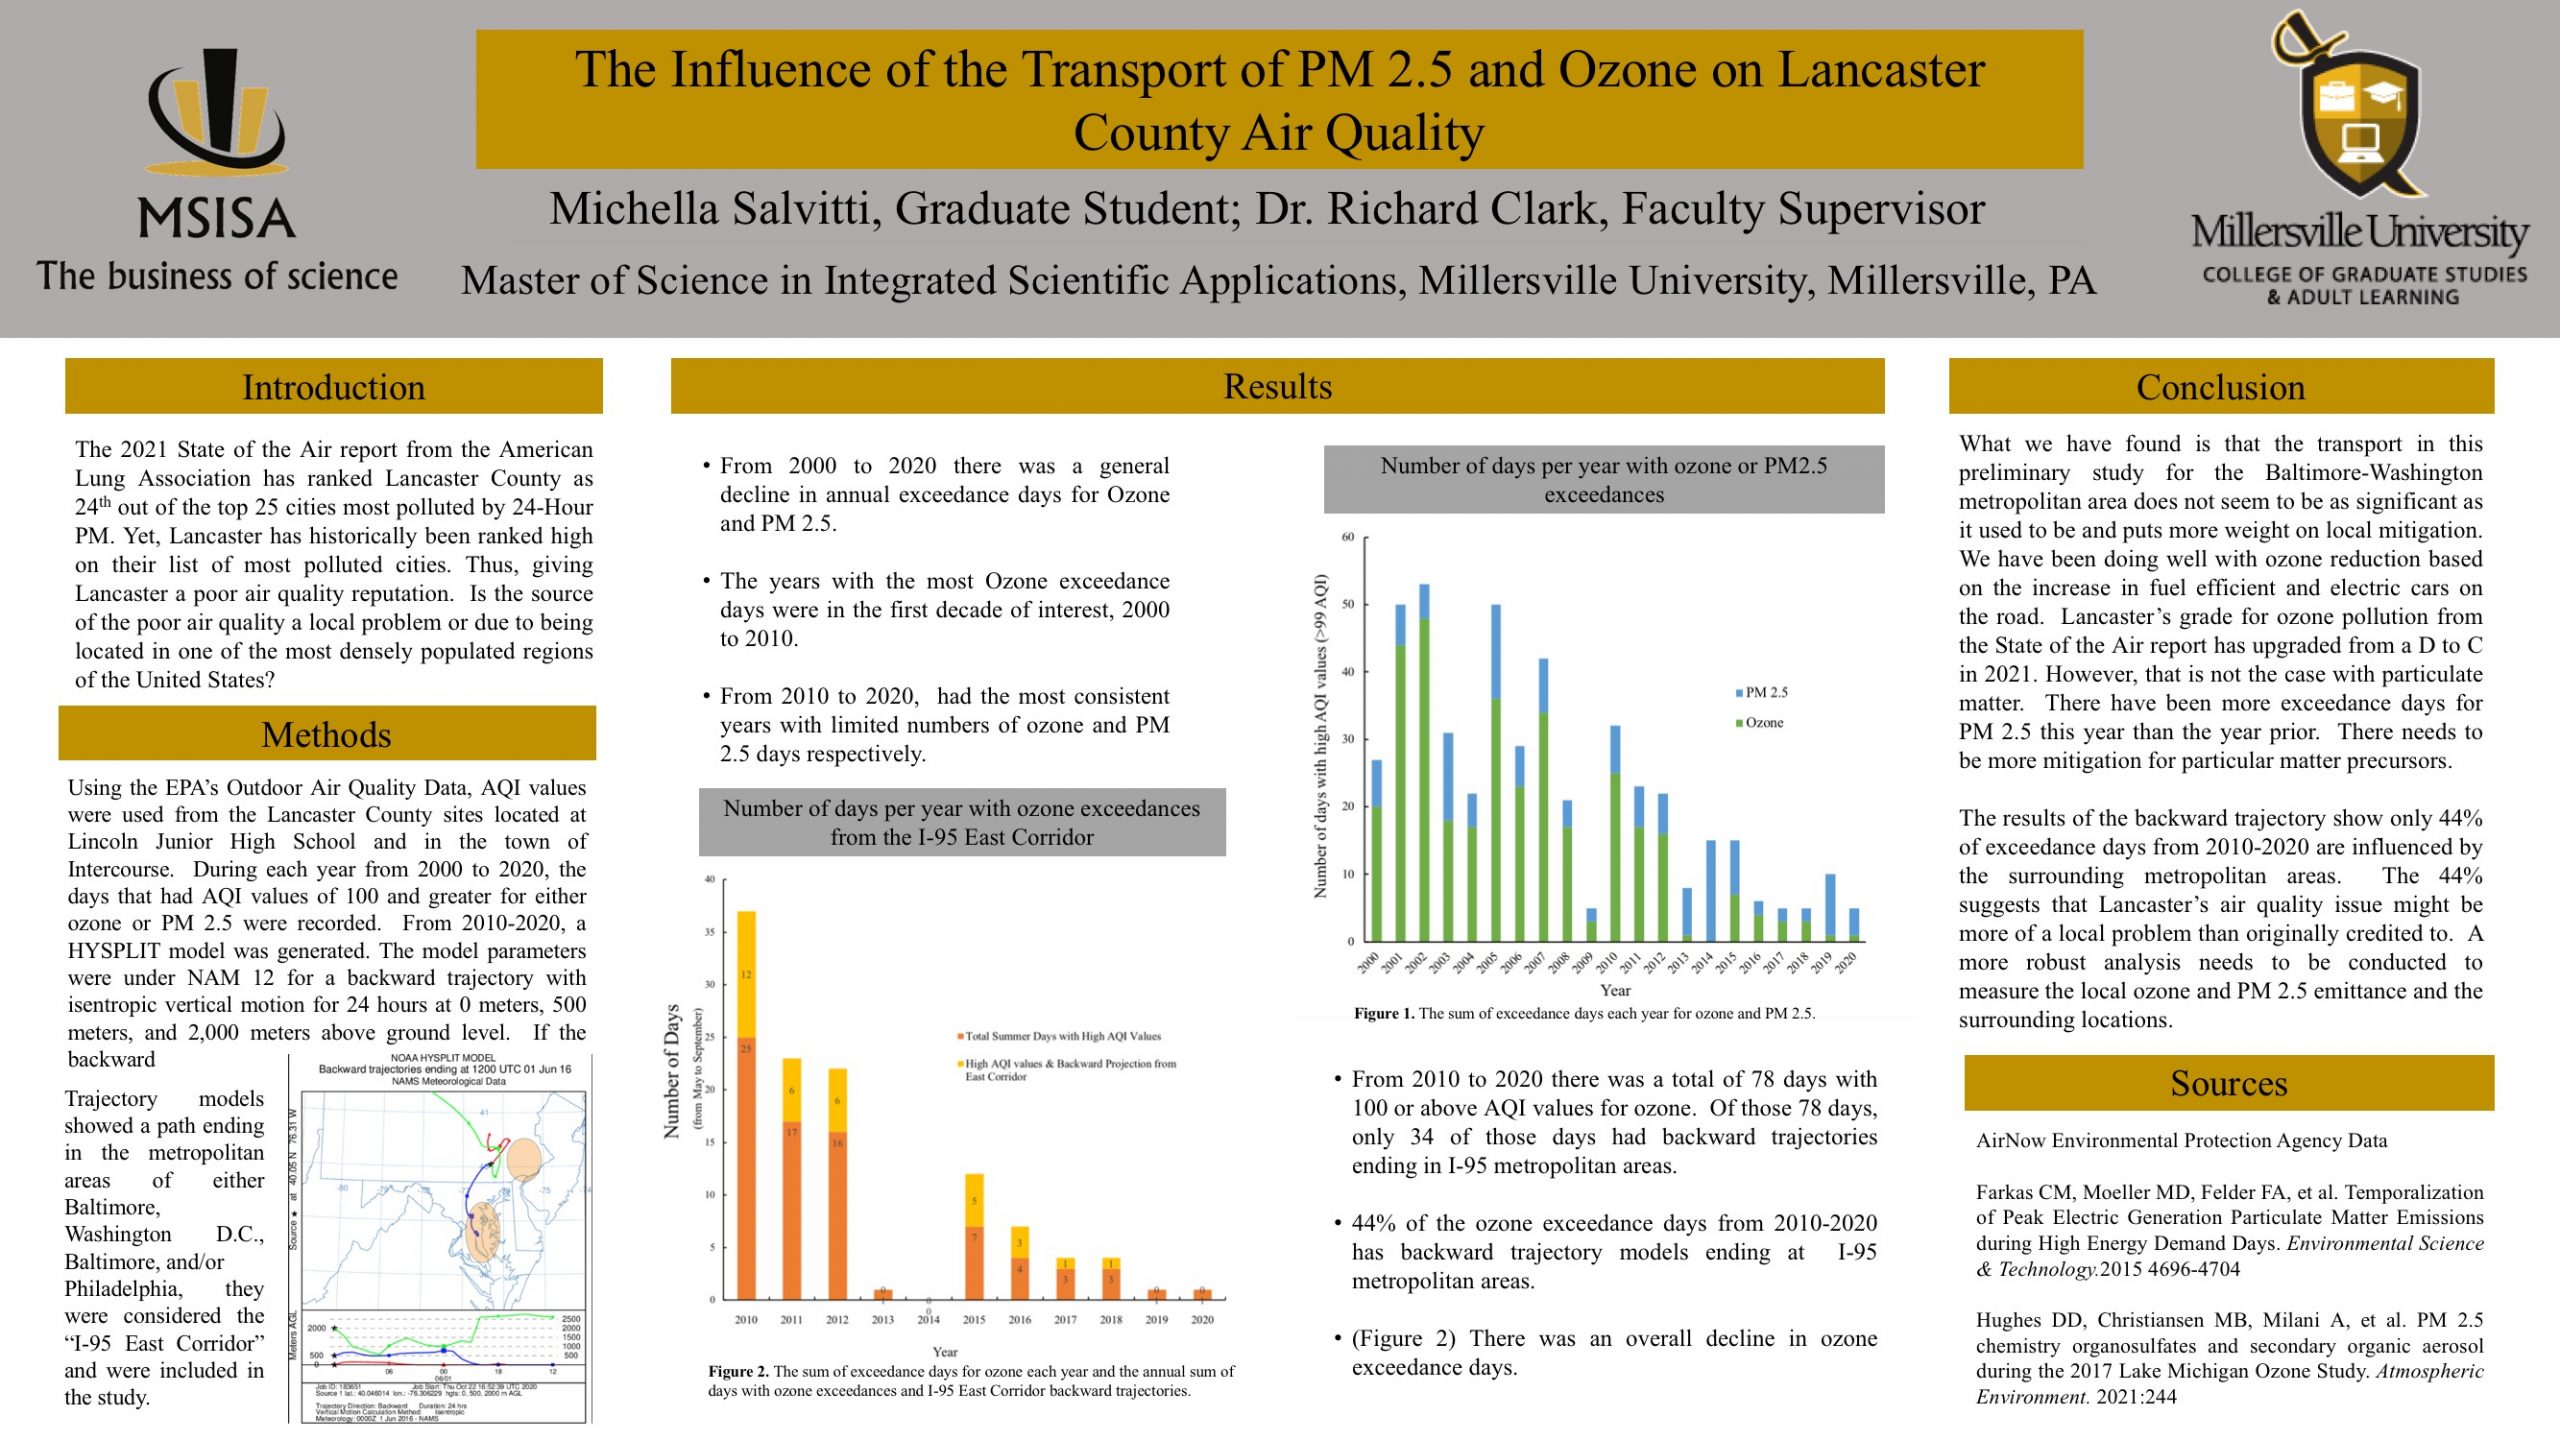
The most populated region of the United States is the Northeast Corridor. A megalopolis with a high concentrations of human activity can cause environmental health problems. Historically, the New York-Newark, Washington-Baltimore-Arlington, and Philadelphia-Reading-Camden regions make the American Lung Associations’ State of the Air Report’s top 25 Most Polluted Cities in the country for ozone. In the most recent State of the Air report, Lancaster, Pa was ranked 27 of 203 metropolitan areas for annual particle pollution. We generated Hybrid Single-Particle Lagrangian Integrated Trajectory (HYSPLIT) backward trajectory models starting at Lancaster, Pa for each day with ozone exceedances between 2010-2020. That decade recorded 78 days with high ozone values. Of those 78 days, 44% of days have models that show air particles from metropolitan areas along the Northeast Corridor present in Lancaster air.